Recent research have substantially advanced our understanding of AI's labor market effects. Studies like Eloundou et al.'s mapping of GPT exposure across occupations, Acemoglu's work on task displacement, and Goldman Sachs' 2023 projections on job automation have established a rigorous foundation, most recently as has Anthropic's own analysis of Claude usage patterns. What remains harder to measure is what's happening across the full ecosystem of AI tools simultaneously, at the skill level, in real time.
Drawing from Cornerstone’s workforce intelligence platform, which tracks 48,225 distinct skills across all major AI platforms, 1.27 billion job postings, and 1.01 billion resumes covering 528,159 geographic regions globally, it measures AI adoption the way employers actually experience it: through the skills they demand and the talent they compete for.
The picture that emerges is clear. AI is not eliminating jobs. It is recomposing the tasks within them, creating new demand faster than the workforce can fill it, and raising the credential floor in ways that affect entry-level workers most.
Theoretical AI capability vs. observed skill adoption
Share of job tasks that AI could theoretically automate vs. what skill-level data shows is adopted across 16 occupational categories.
Across all 16 occupational categories, observed skill adoption averages 31% compared to 40% theoretical capability. The gap varies significantly by occupation:
- Architecture & Engineering shows theoretical capability at 90% but observed adoption at 67%.
- Legal stands at 55% theoretical versus 34% observed.
These gaps reflect the difference between what AI could do in principle and what the labor market has absorbed in practice.
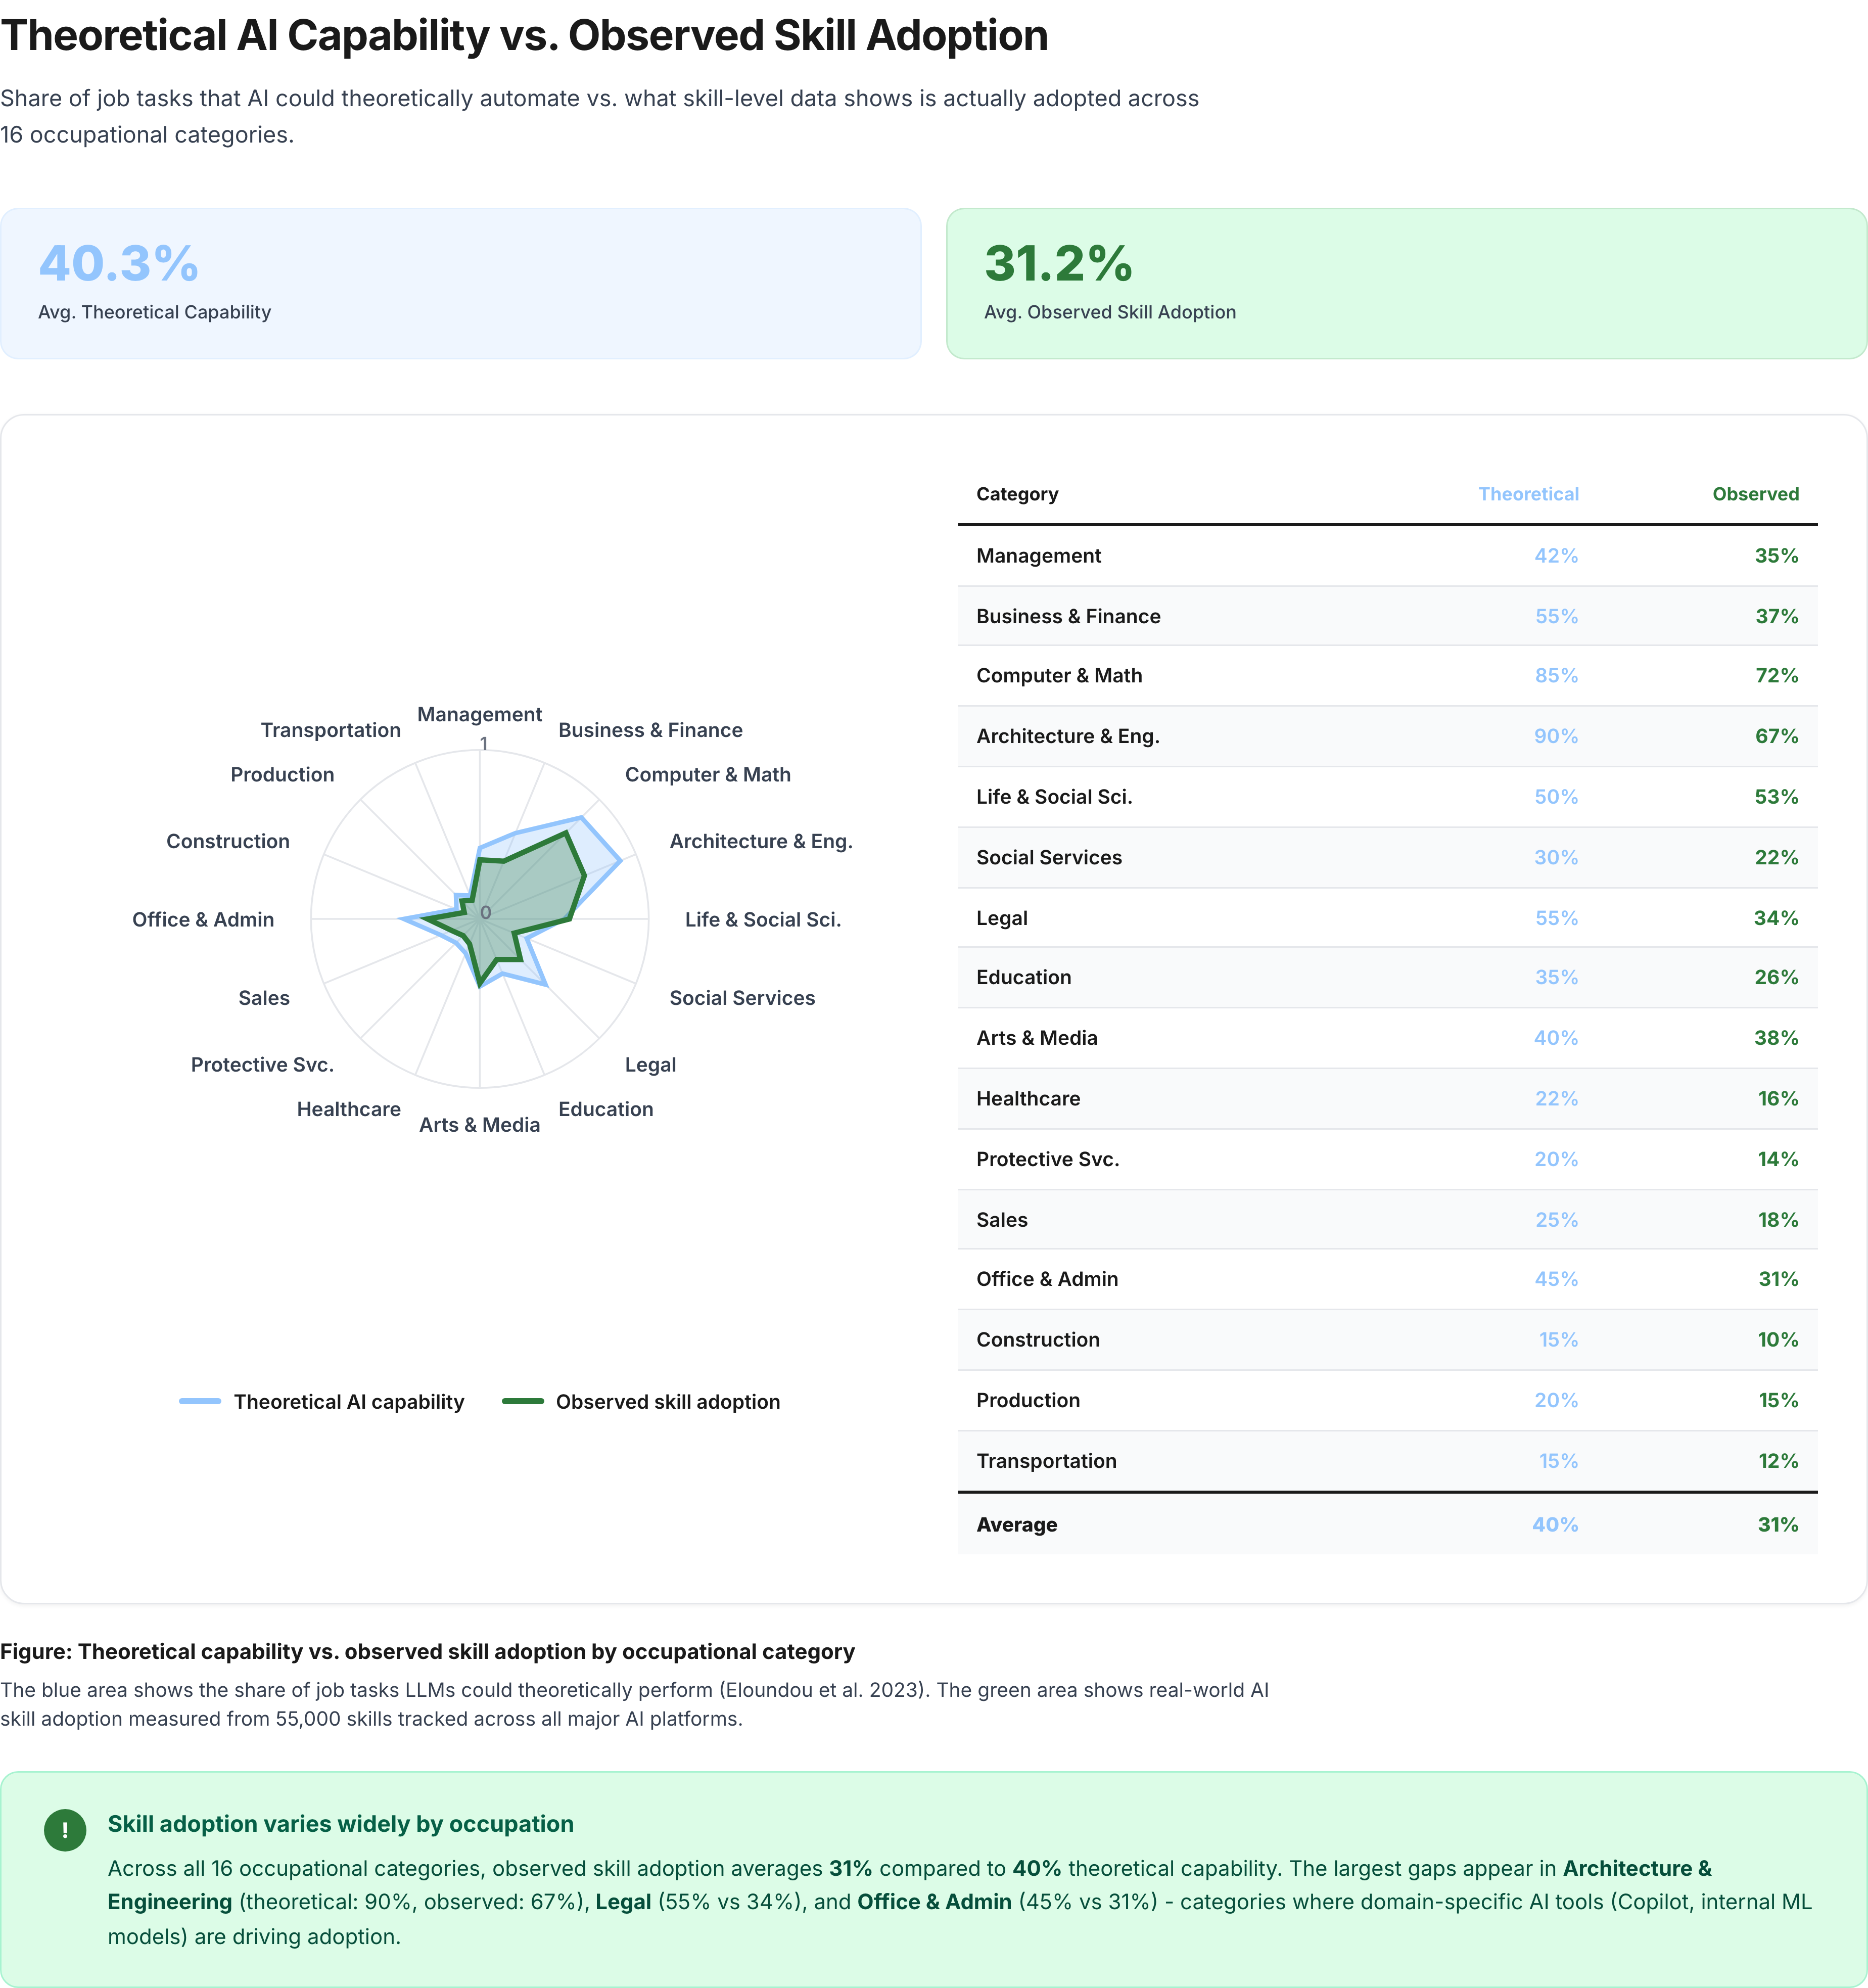
Figure 1: Theoretical capability vs. observed skill adoption by occupational category. Blue = theoretical capability (Eloundou et al. 2023). Green = real-world AI skill adoption measured from 55,000 skills tracked across all major AI platforms.
AI skill exposure by occupation
15 of 16 occupational categories show positive demand growth regardless of AI exposure level. Higher exposure does not predict displacement.
When AI skill exposure is plotted against year-over-year demand growth, the result is unambiguous: every occupational category with significant AI exposure shows positive demand growth.
Computer & Math (21.85% exposure) and Life & Social Sciences (16.64%) lead with 36.5% and 18.1% YoY demand growth respectively. The categories with the lowest AI exposure (Construction at 0.16%, Production at 0.15%) actually show less consistent growth than the highly exposed ones. AI exposure is functioning as a growth signal, not a displacement risk factor.
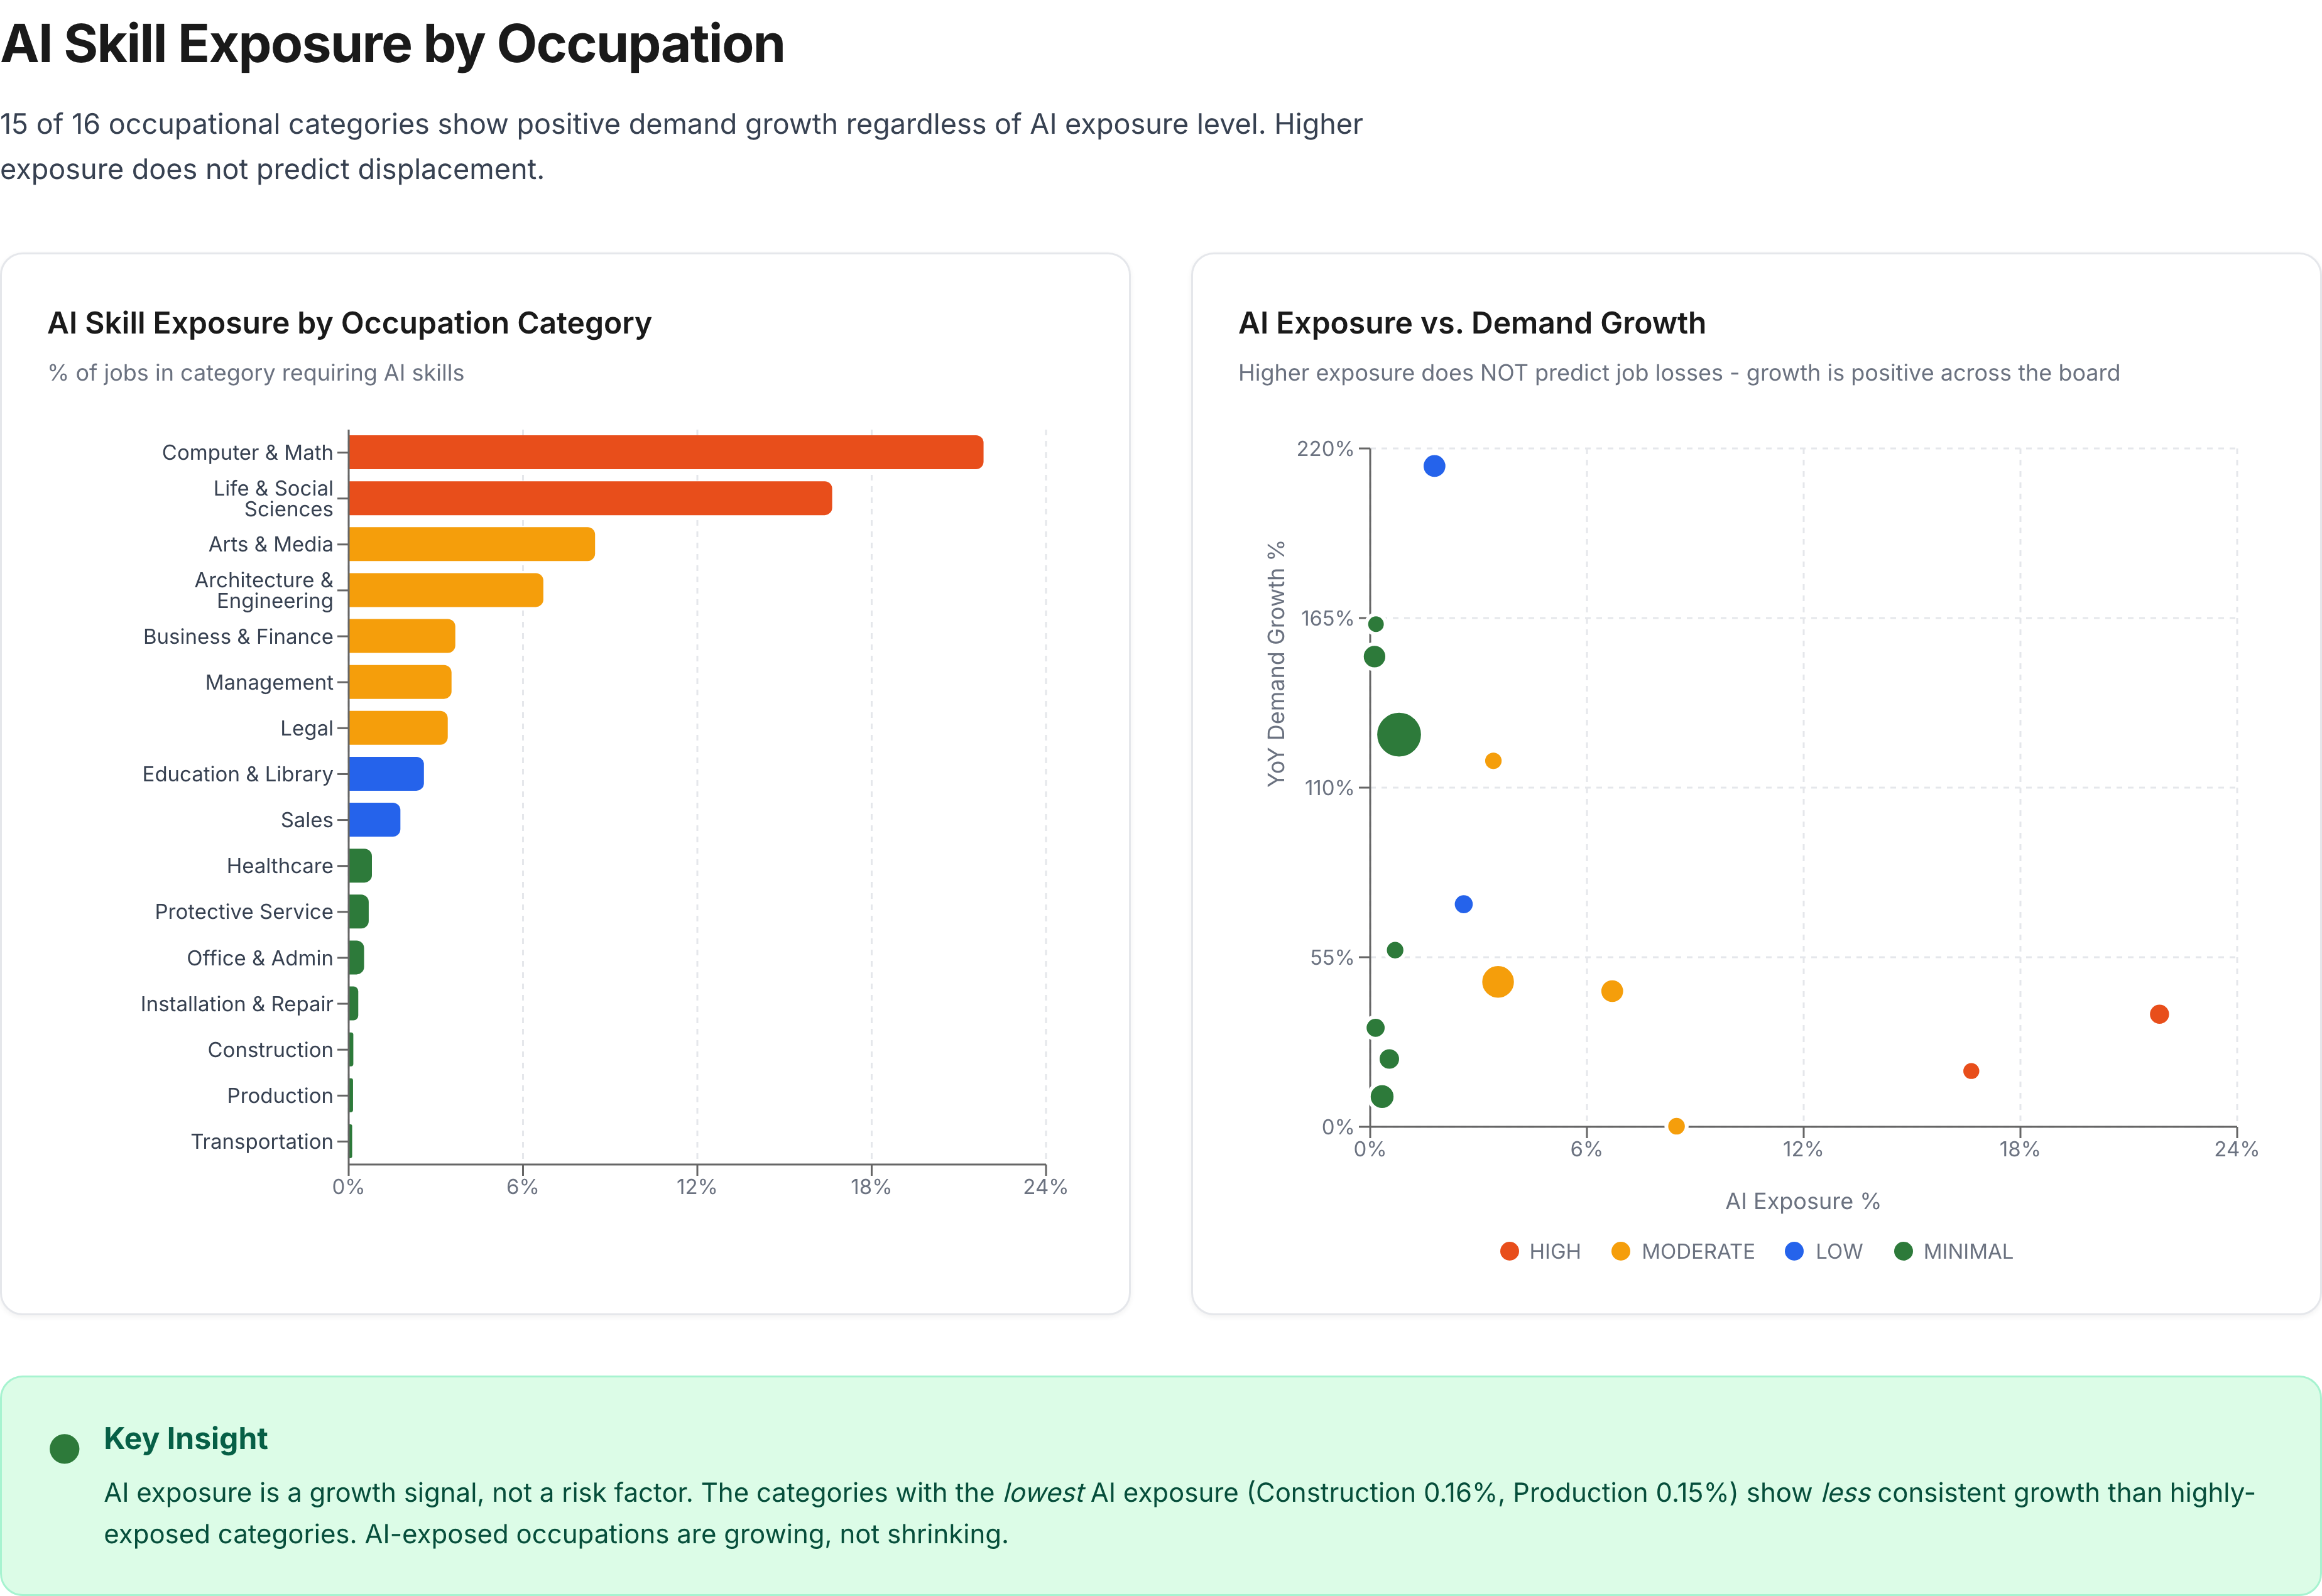
Figure 2: Left: AI skill exposure by occupation category (% of jobs requiring AI skills). Right: Exposure vs. demand growth scatter plot. 15 of 16 categories growing; one flat.
Experience distribution: AI jobs vs. all jobs
AI roles skew heavily toward mid-career workers. The entry-level gap is a credentialing barrier, not displacement.
- Entry-level workers (0–2 years of experience) hold 54.7% of all jobs but only 24.8% of AI jobs, a 29.9 percentage point gap.
- Workers with 3–5 years of experience hold 43.6% of AI jobs versus 20.7% of all jobs. This is not AI replacing young workers.
It is AI roles demanding experience that entry-level workers do not yet have. For this analysis, an "AI job" is defined as any role in which at least one of the demanded skills is tagged as AI-related within Cornerstone's 55,000-skill taxonomy, meaning the role explicitly requires AI capability as part of its skill profile.
This distinction matters for policy response. If the problem were displacement, the response would be regulation and slower deployment. Because the problem is a credentialing barrier, the correct response is upskilling programs, apprenticeships, and revised hiring practices. As AI tools mature and become more accessible, this credential barrier should naturally lower.
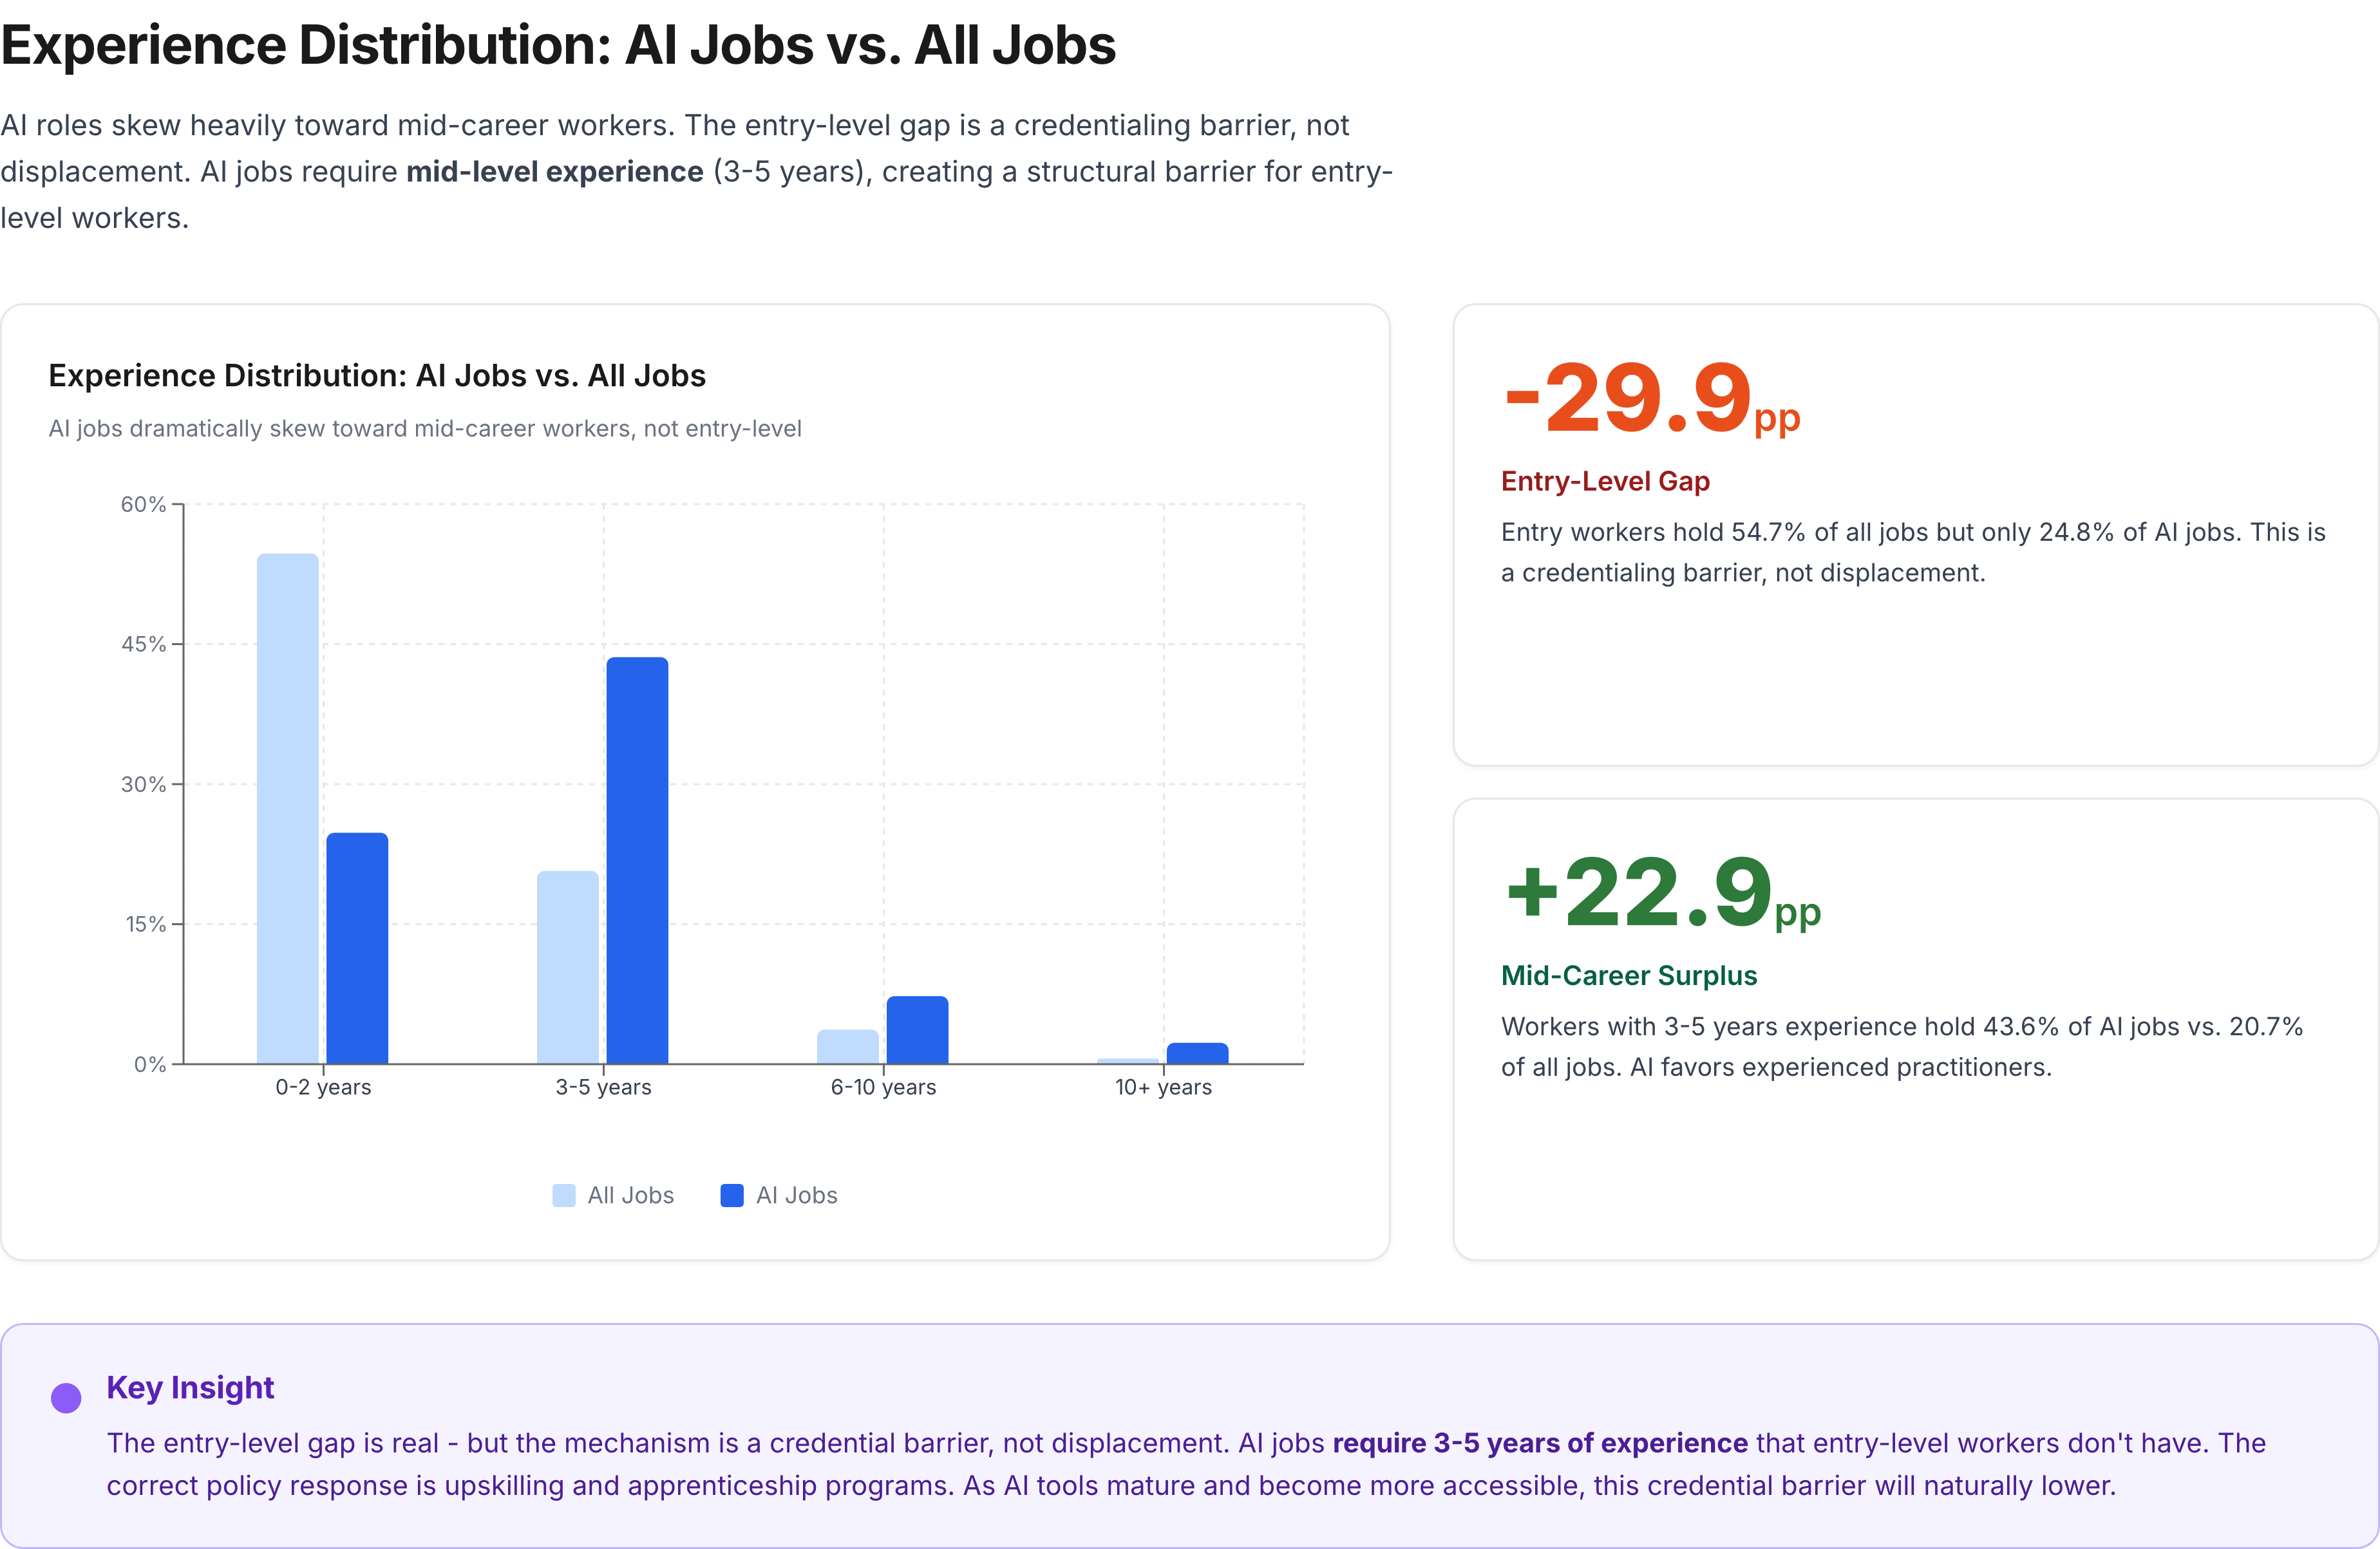
Figure 3: Experience distribution for AI jobs vs. all jobs. Entry-level gap of -29.9pp and mid-career surplus of +22.9pp.
AI skill adoption across all occupations
Every occupational category shows measurable AI skill demand, from Computer & Math (24.1%) to Transportation (0.12%).
When skills are measured across all AI platforms rather than a single provider, every occupational category shows measurable AI skill penetration. Transportation, the lowest at 0.12%, still shows 152.5% demand growth. Production at 0.15% shows real adoption. A plumber using AI-powered diagnostic tools, a nurse using AI-assisted triage systems, a truck driver using AI route optimization: all of these register in skill-level tracking across the 55,000-skill taxonomy.
The tier analysis reveals the full picture. Categories with minimal AI exposure (under 1%) account for 55.9% of the workforce, totaling 24.8 million jobs, and show an average of 72.5% demand growth with a demand-supply gap of 1.38x. The true zero-exposure rate approaches 0% when skills are measured across all AI platforms and tools.
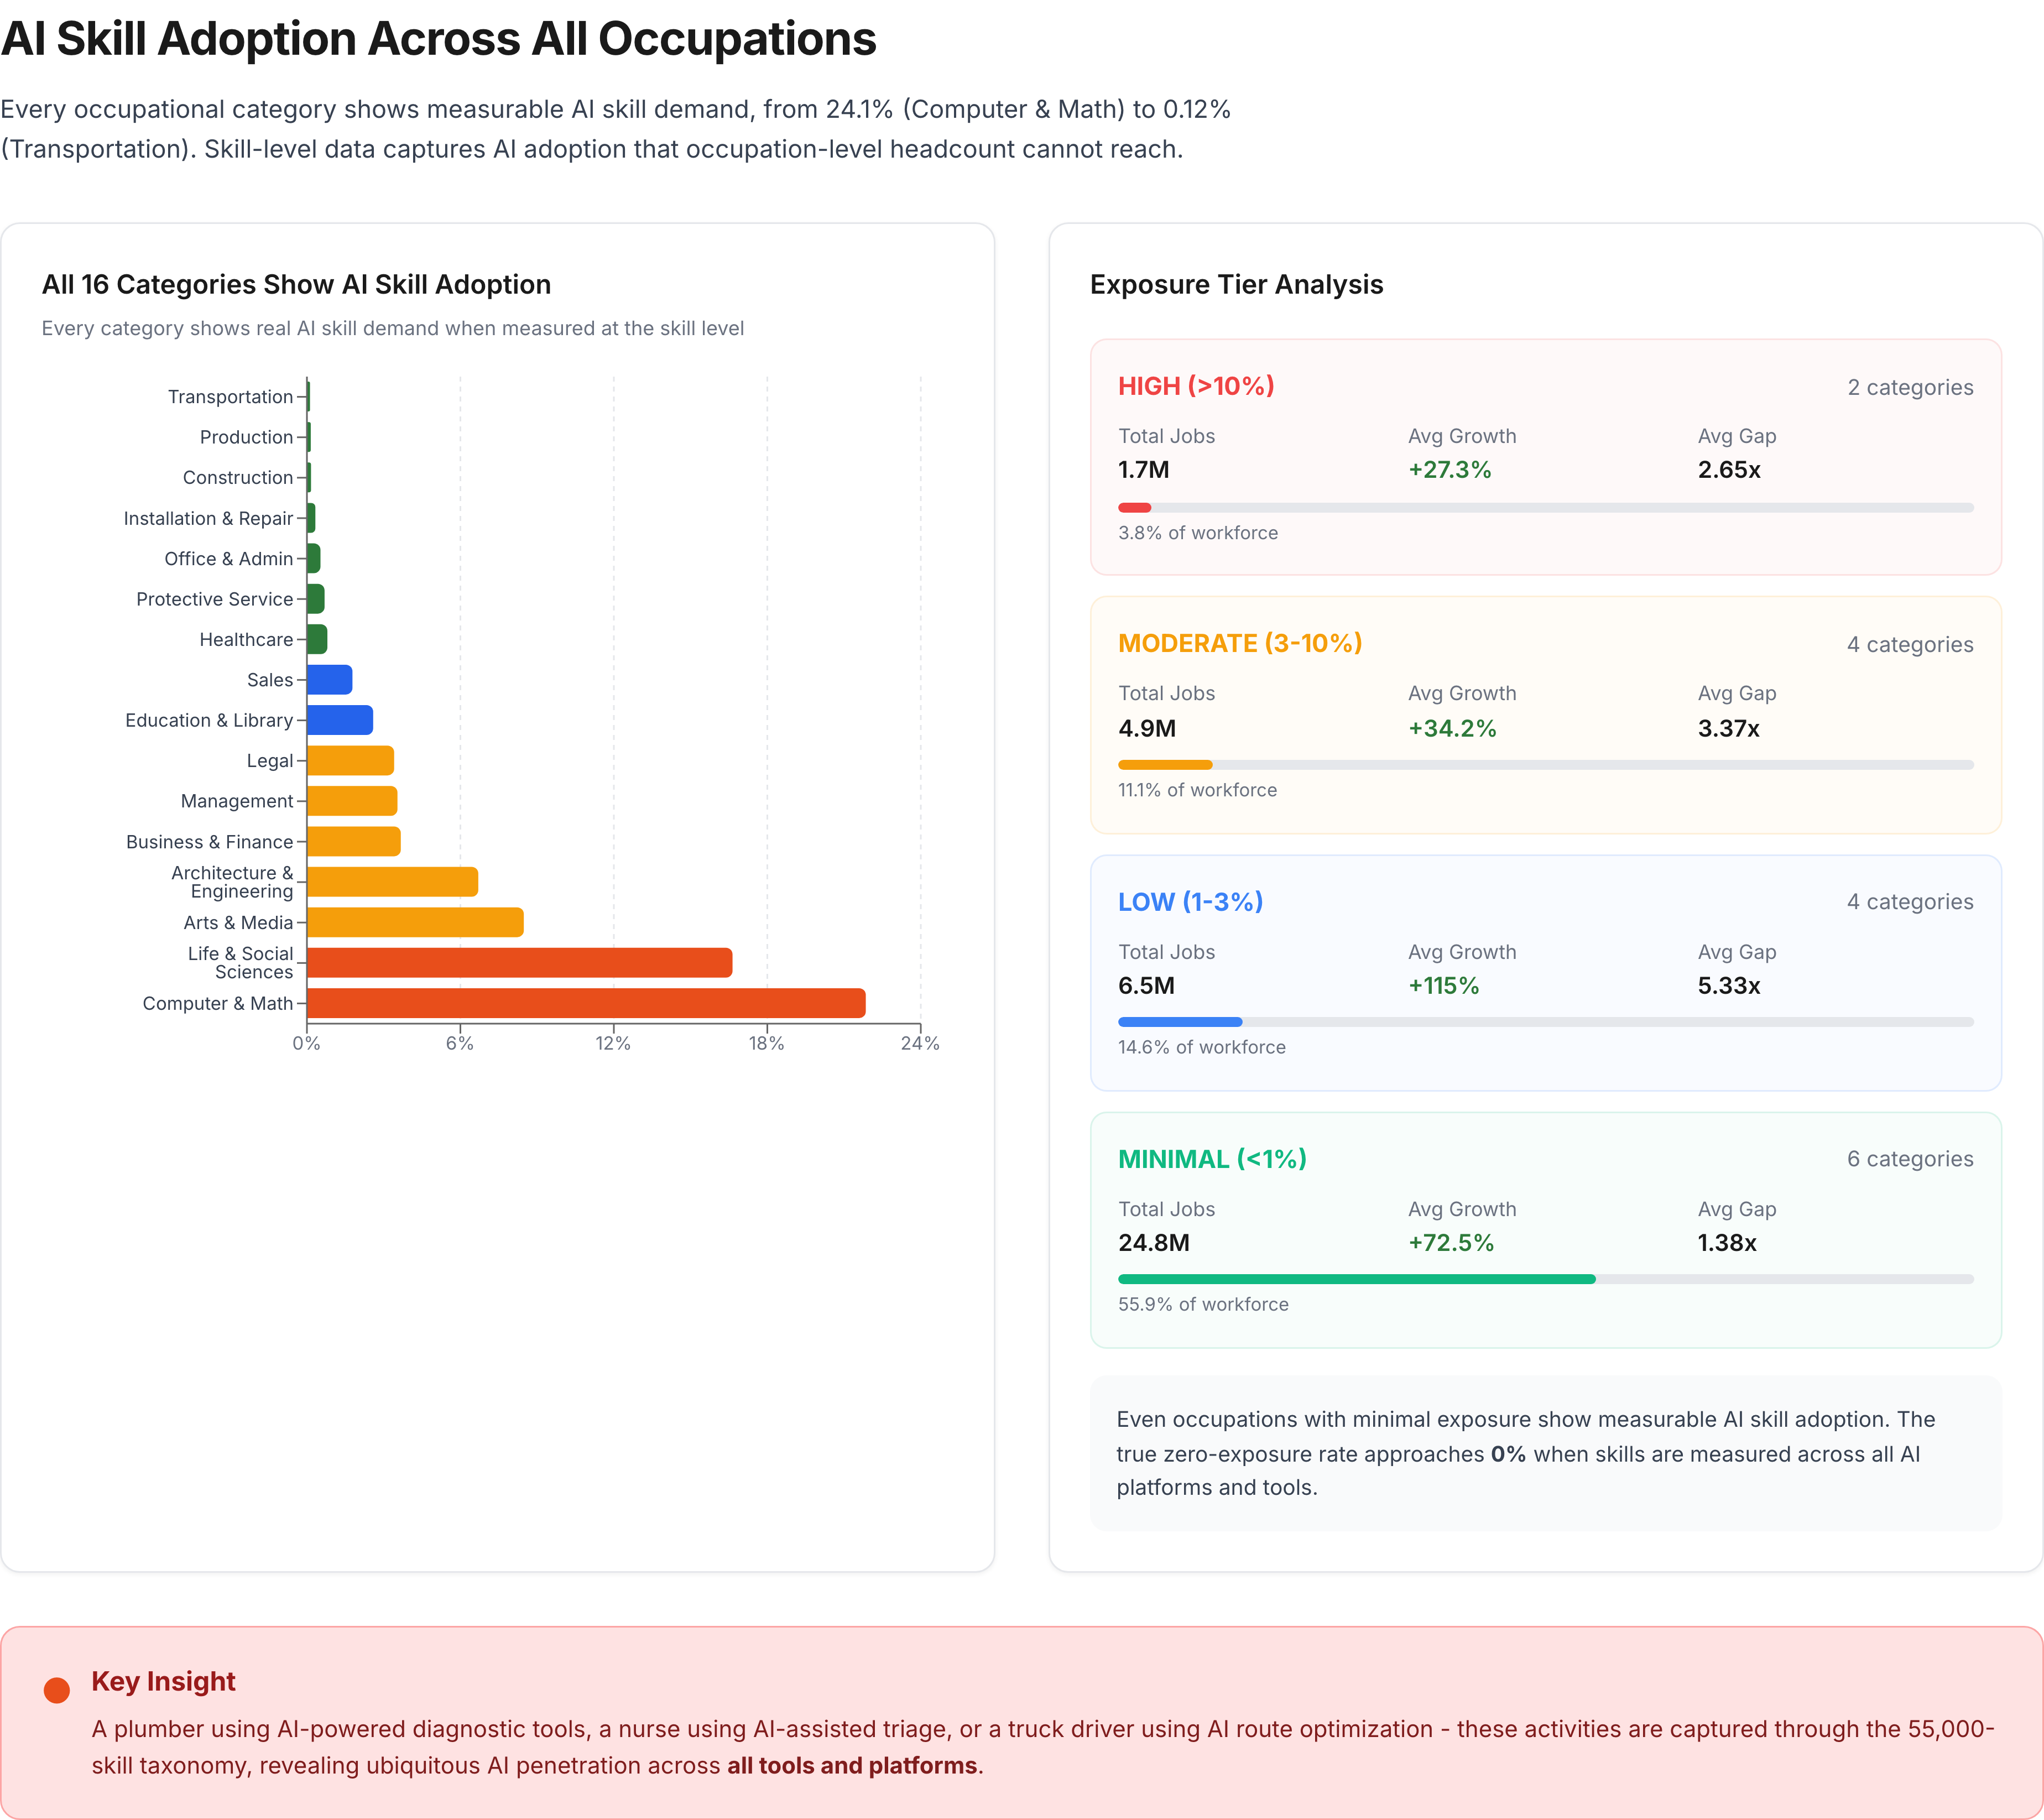
Figure 4: All 16 categories show AI skill adoption. Exposure tier analysis showing growth and demand-supply gaps across HIGH, MODERATE, LOW, and MINIMAL tiers.
Demand-supply gap: AI talent shortage by occupation
12 of 16 categories have demand exceeding supply. Average gap: 3.2x. The data shows a hiring boom, not displacement.
Across 16 occupational categories, 12 show demand exceeding supply.
- Legal occupations have a 9.2x demand-to-supply gap despite 118.7% YoY growth.
- Healthcare sits at 7.9x with 127.2% growth.
- Sales at 6.9x.
If AI were displacing workers in these fields, the gap would narrow. Instead, AI adoption is creating new roles faster than the workforce can fill them. The average demand-supply gap across all categories is 3.2x.
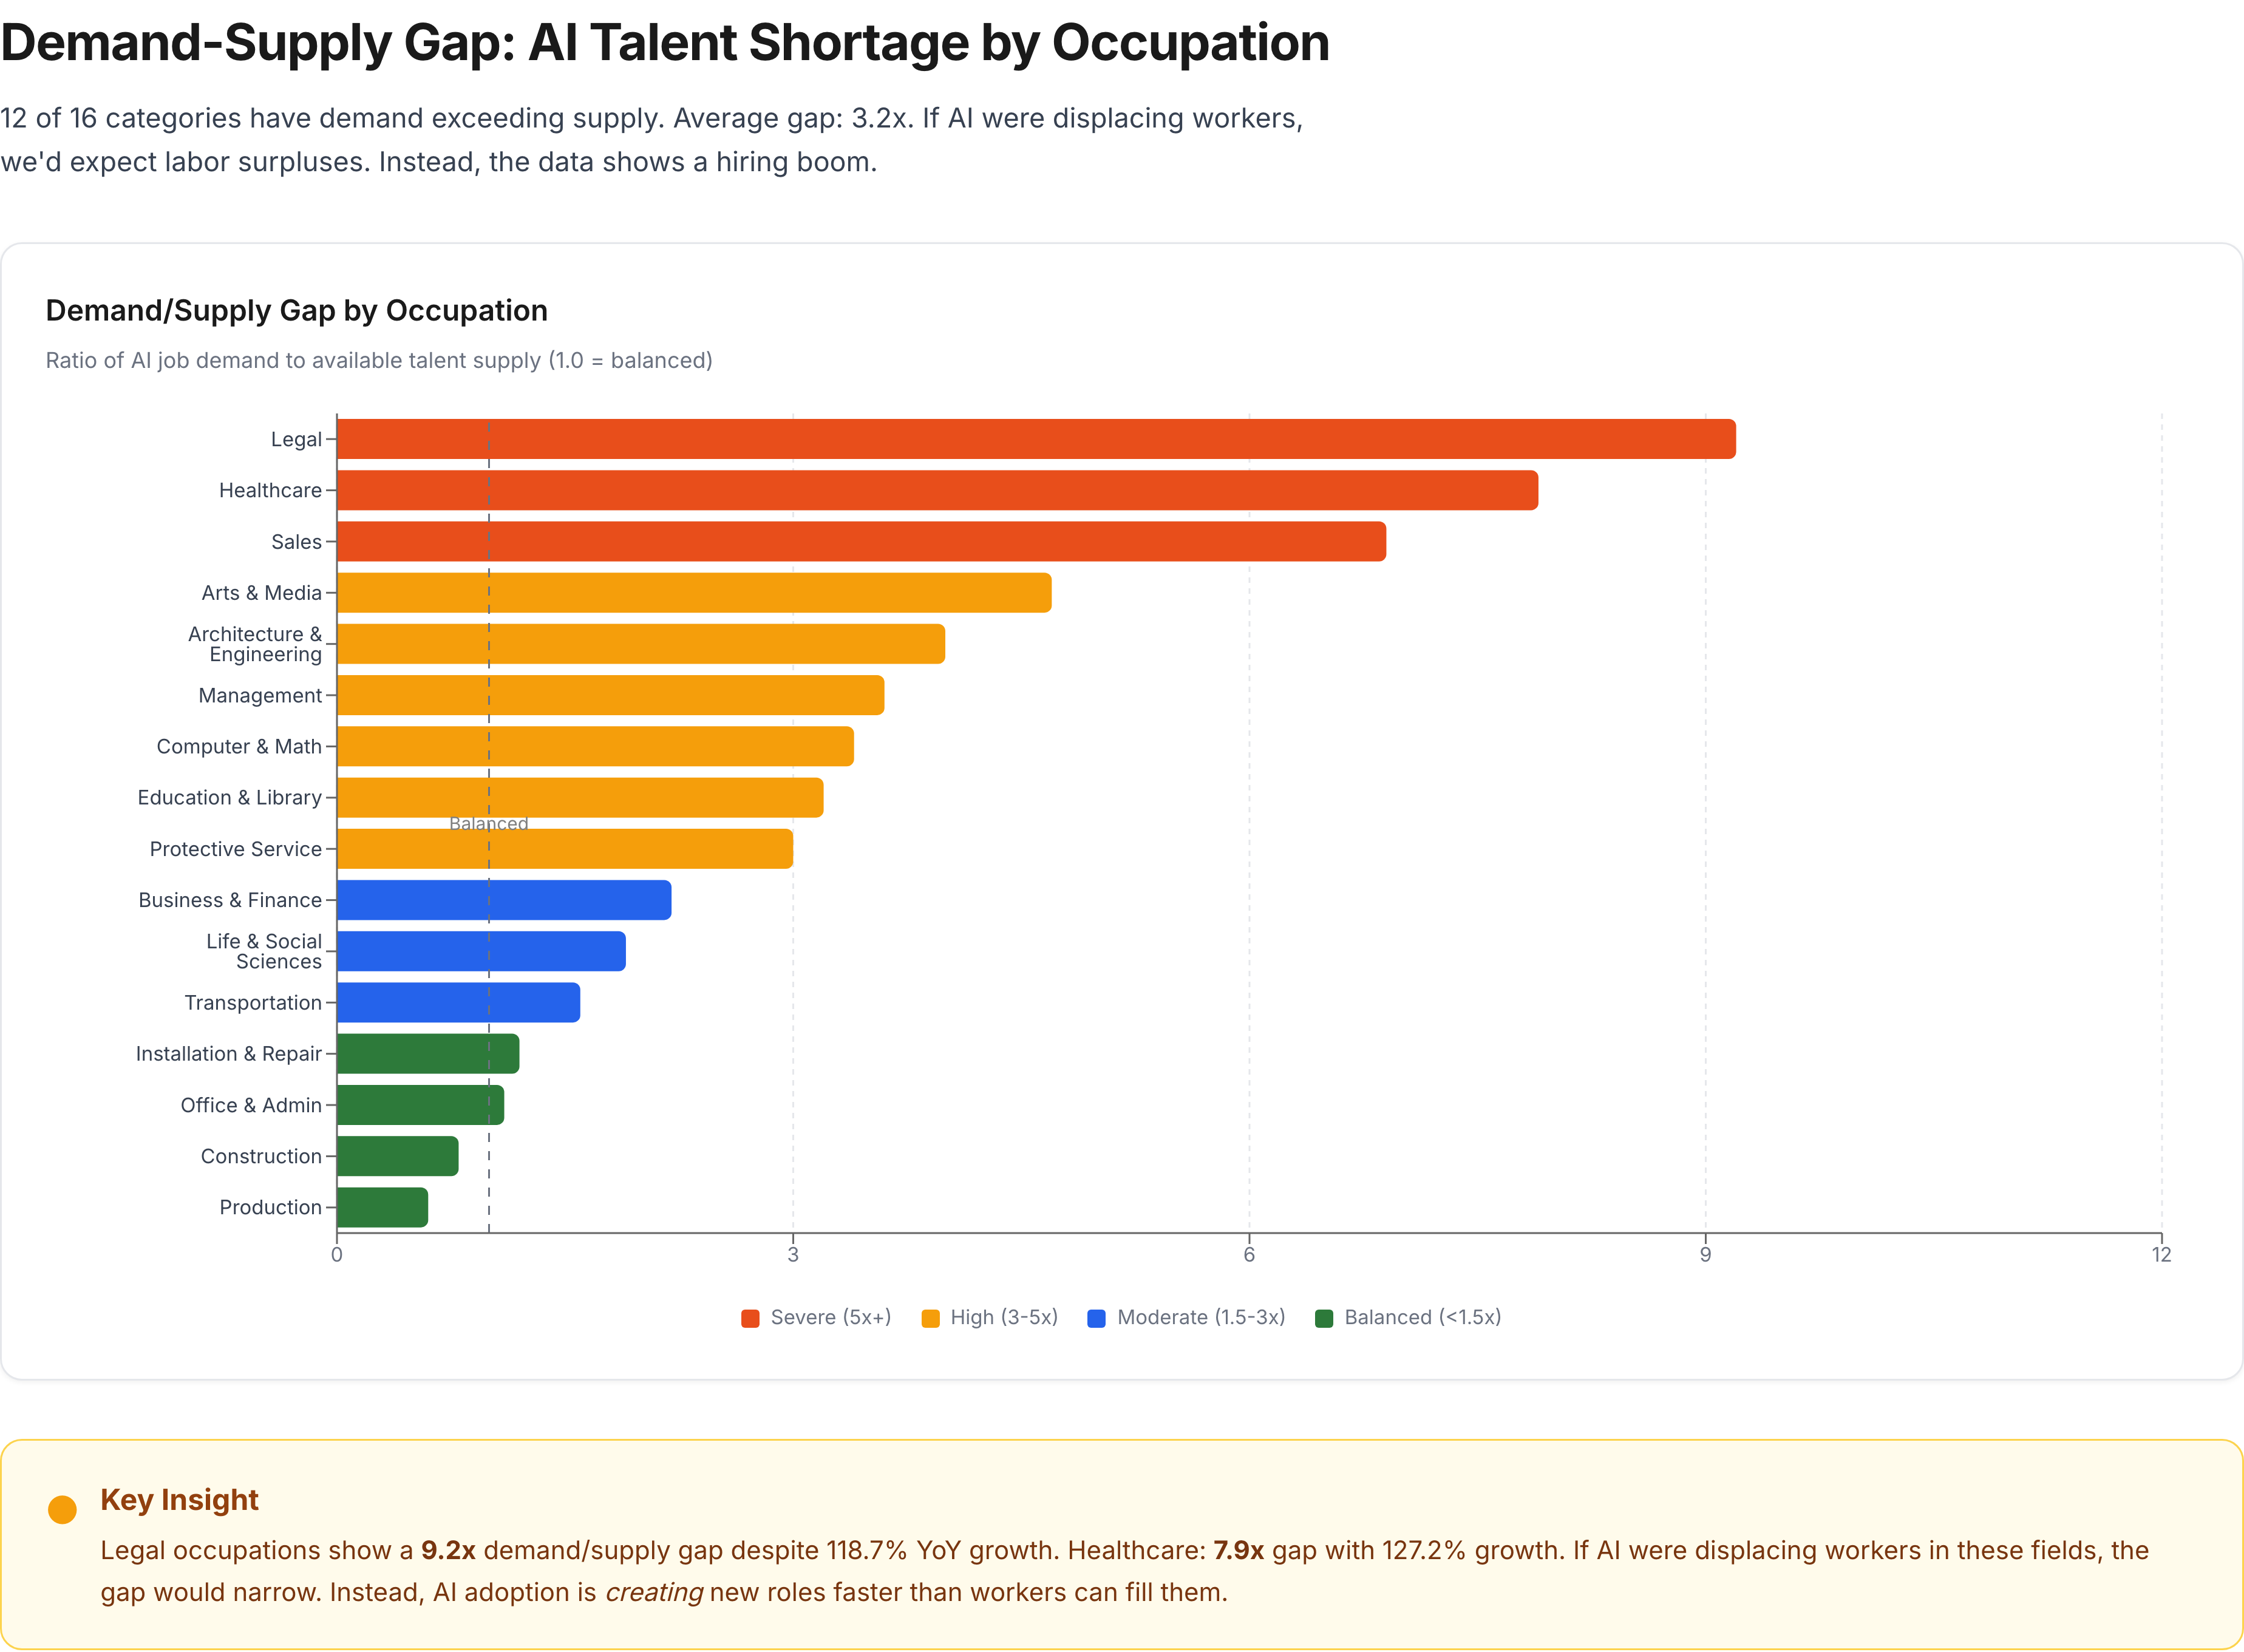
Figure 5: Demand-supply gap ratios by occupation (1.0 = balanced). Color-coded by severity: severe (5x+), high (3-5x), moderate (1.5-3x), balanced (<1.5x).
Most AI-exposed occupations: theoretical exposure vs. actual demand growth
The top 10 most theoretically AI-exposed SOC codes were mapped to 85 normalized titles. The most theoretically exposed occupations all show positive demand growth.
- Computer programmers, ranked as the single most theoretically exposed occupation at 74.5%, show 36.5% demand growth.
- Data scientists at 69.3% theoretical exposure show identical 36.5% growth. Paralegals at 51.4% show a remarkable 118.7% surge.
- Accountants at 48.3% show 45.4% growth. Not a single one of the most theoretically exposed occupations shows declining demand.
The roles flagged as highest theoretical risk are the ones with the strongest growth trajectories.
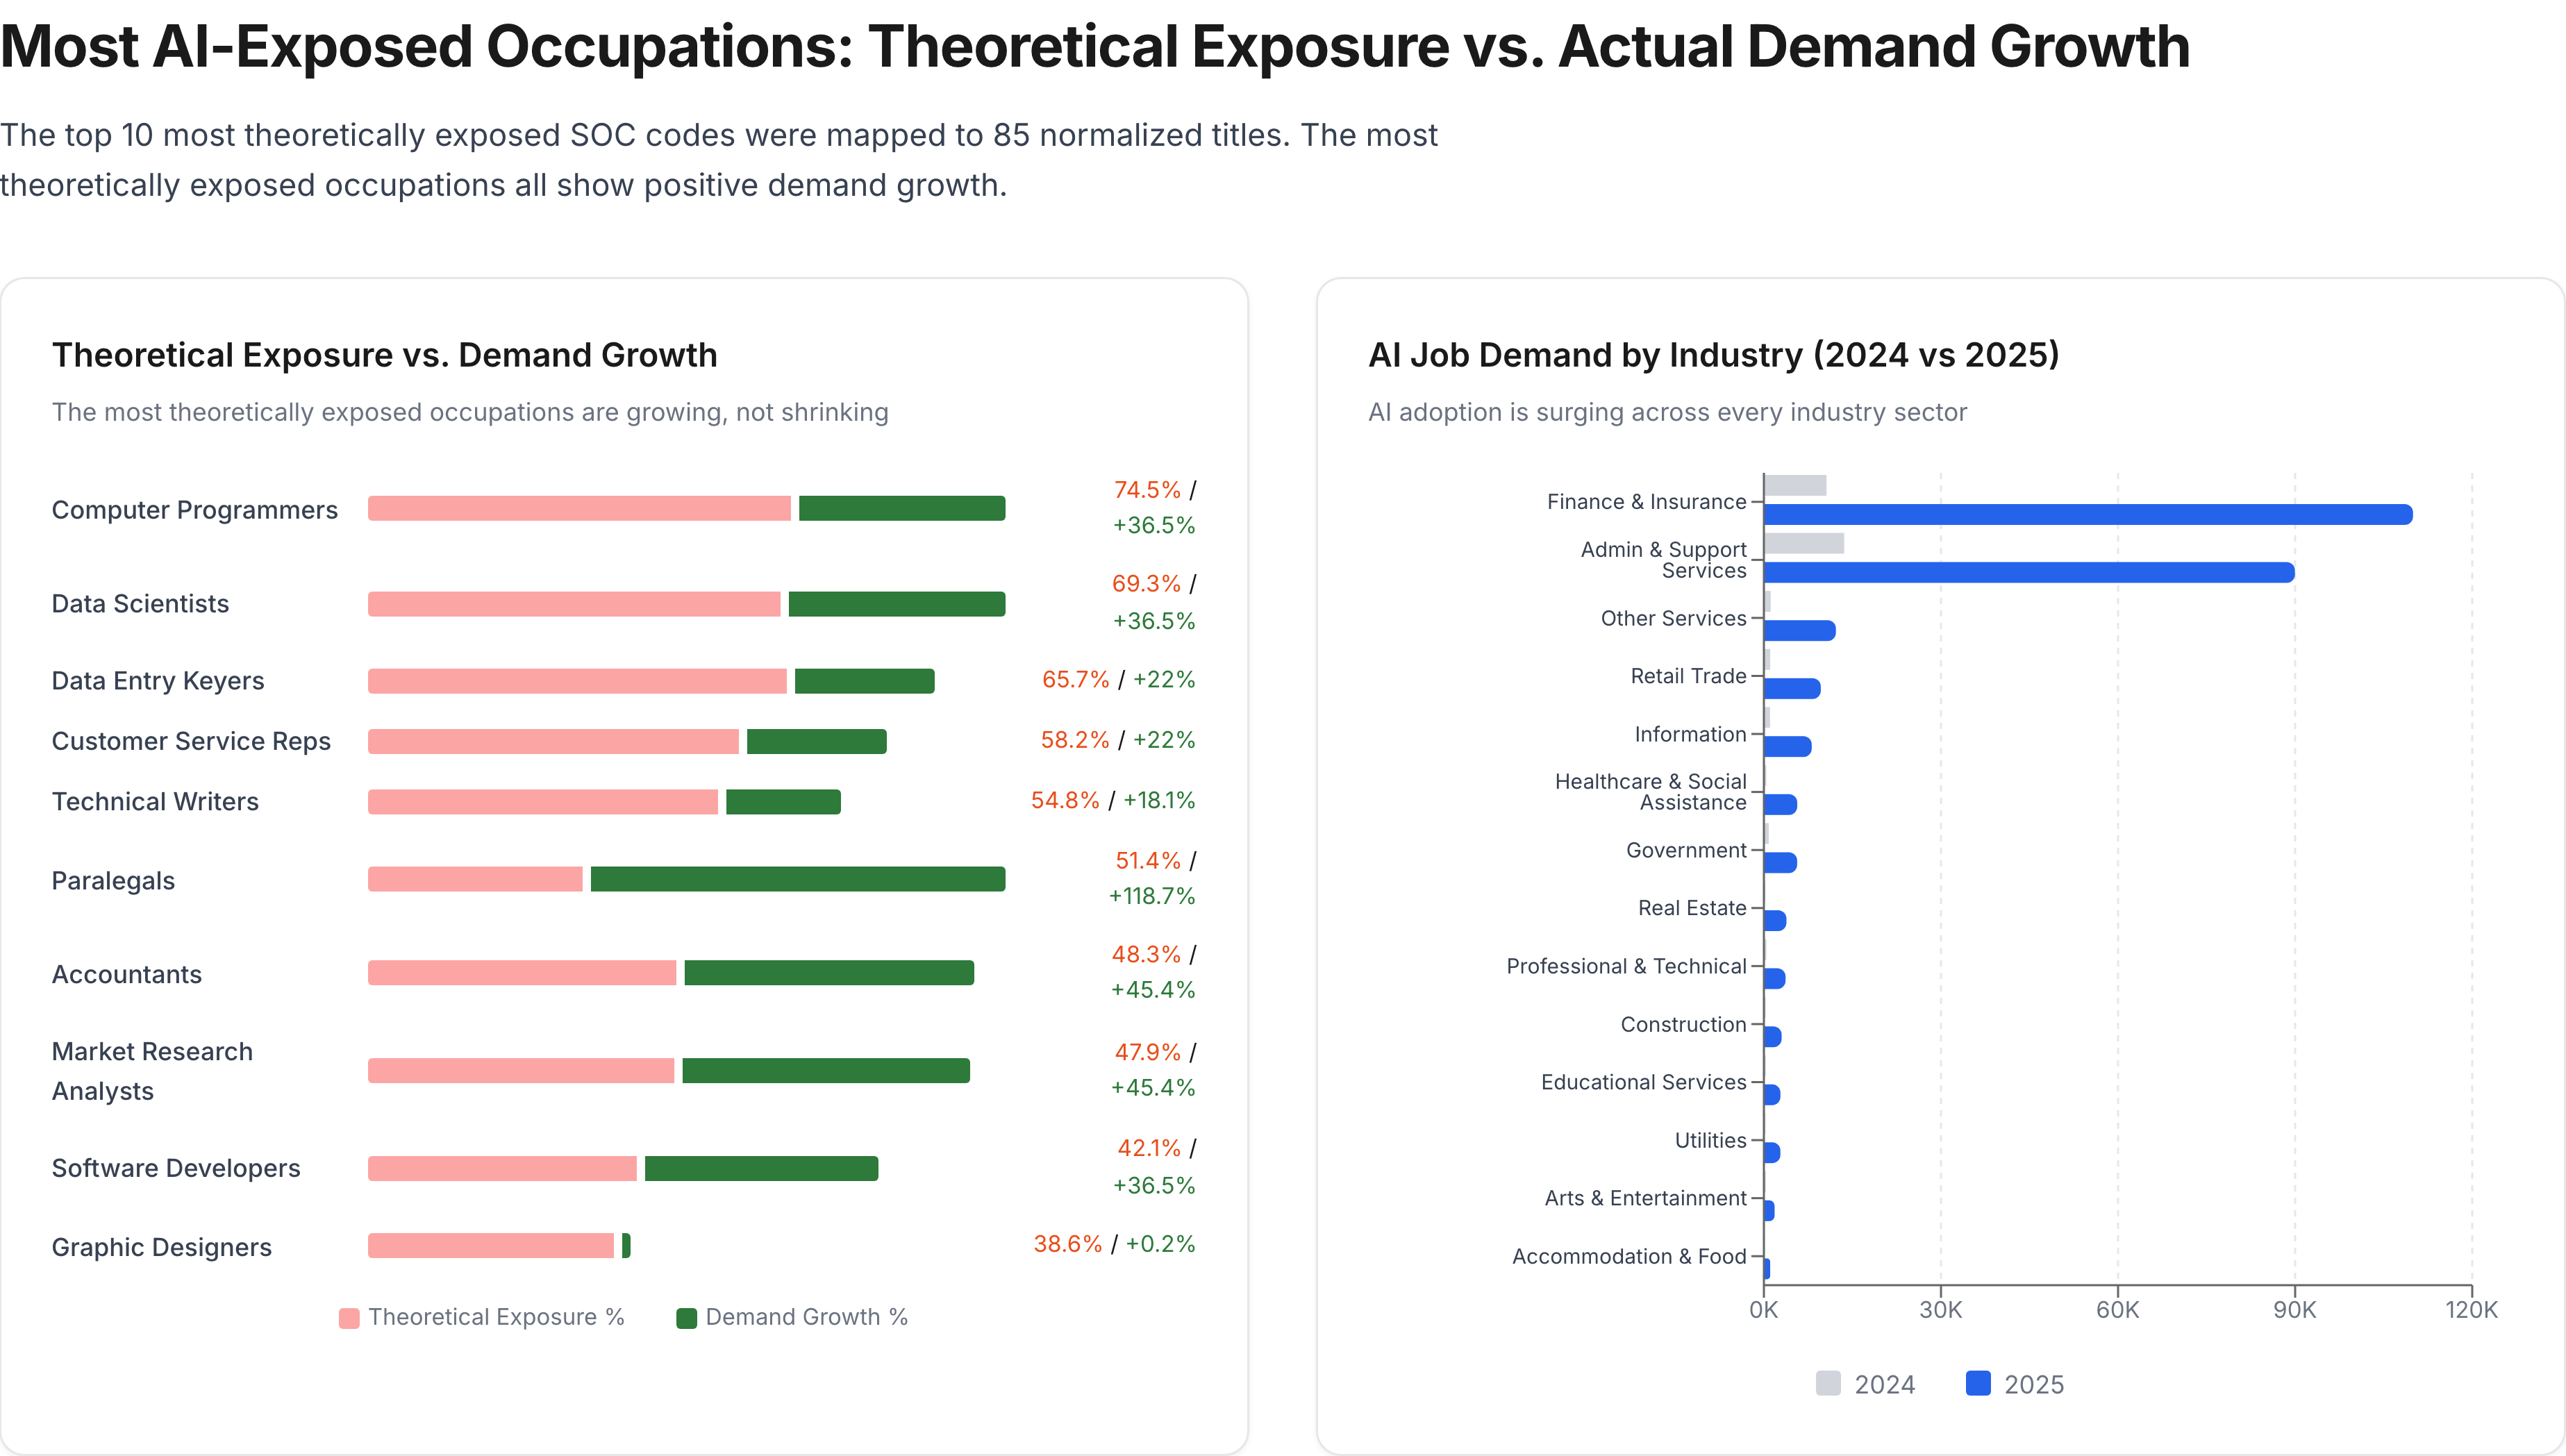
Figure 6: Left: Top 10 most theoretically exposed occupations mapped to Cornerstone demand growth. Right: AI job demand by industry (2024 vs. 2025).
Pink collar occupations: AI exposure and wage stratification
High-skill roles face shortage. Low-skill roles face automation risk. Policy must differentiate.
Aggregate occupational categories obscure critical dynamics within categories. Nowhere is this more visible than in pink collar occupations: the healthcare, education, administrative, and social service roles disproportionately held by women.
- High-skill pink collar roles (nurses: $64–93K, counselors: $45K, teachers: $41K) face minimal AI displacement risk and severe labor shortages. Healthcare has a 7.9x demand-supply gap. These workers are not at risk; they are in critical shortage.
- Low-skill administrative roles (receptionists: $28K, bookkeepers: $38K, customer service: $35K) face high to very high automation risk. But even here, the story is not simple elimination. Customer Service Managers ($48K) show high demand despite high AI risk, suggesting the role is transforming rather than vanishing.
The policy implication is precise: invest in upskilling pathways from at-risk administrative roles into shortage healthcare and education roles. This specificity is invisible in occupation-level aggregate analysis.
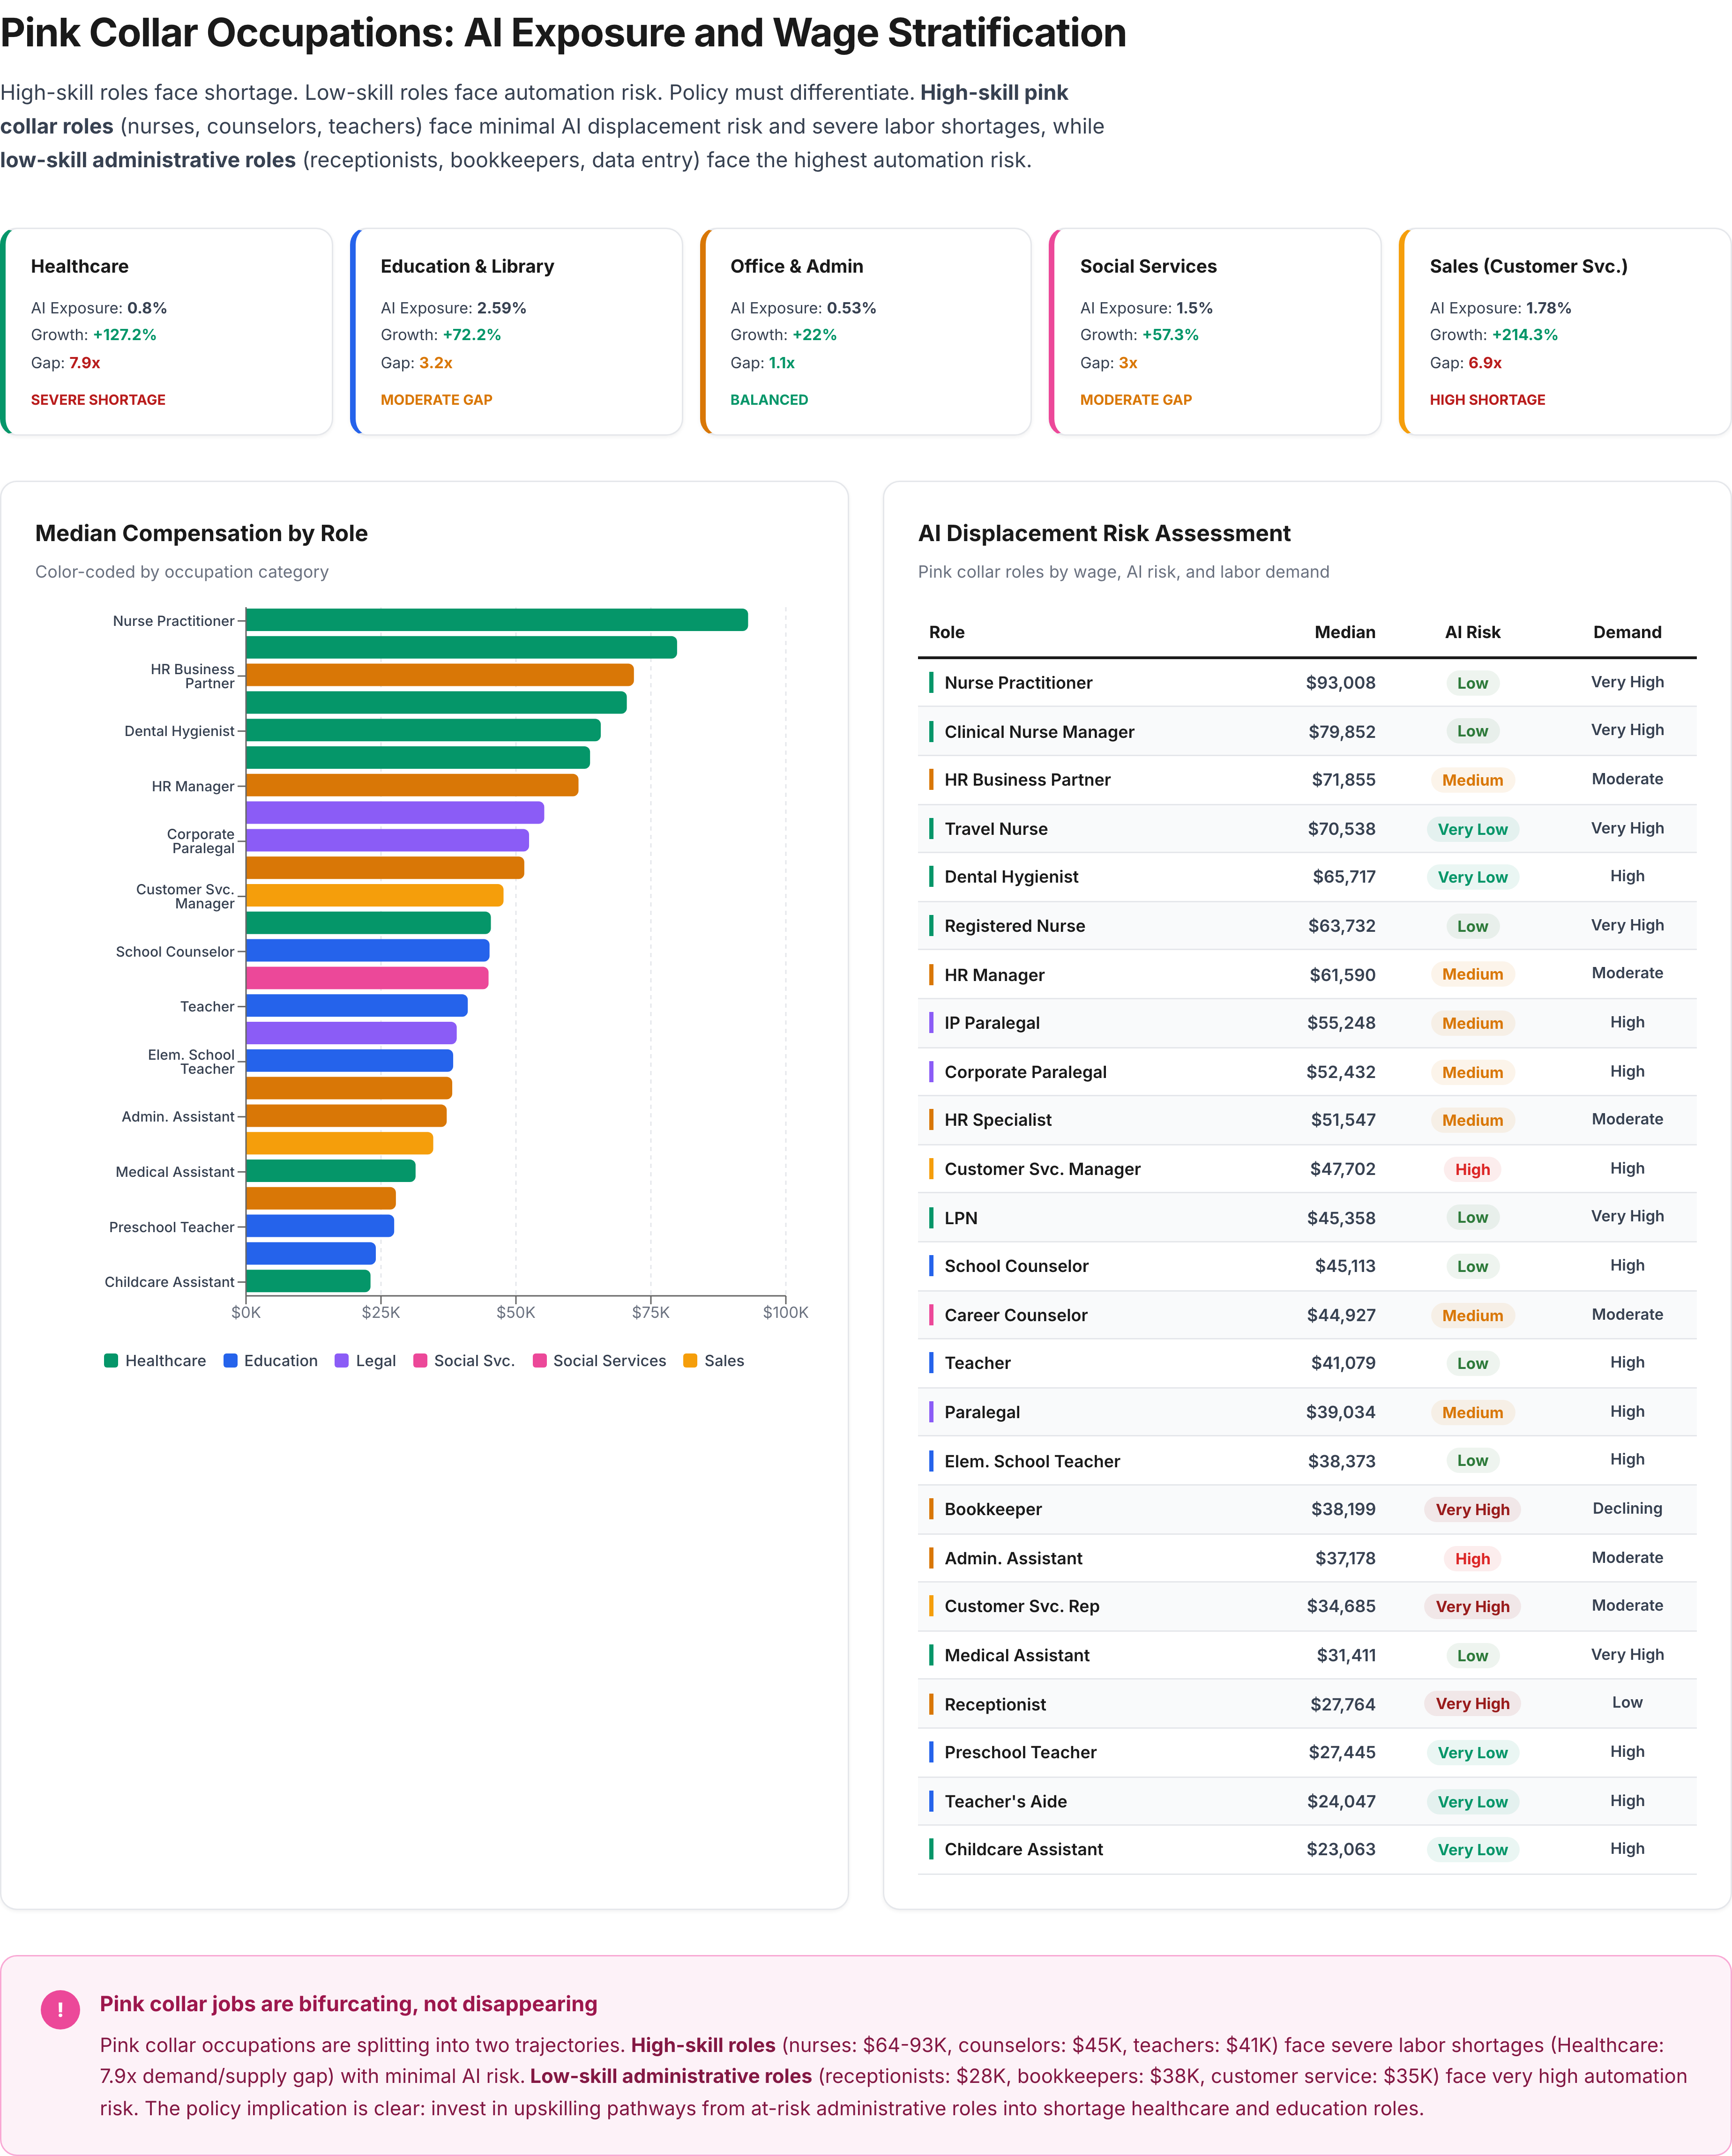
Figure 7: Pink collar occupations by median compensation, AI displacement risk, and labor demand. Color-coded by occupation category.
Key findings
Five evidence-based findings on AI’s impact on the labor market, grounded in workforce intelligence data spanning 1.27 billion job postings.
1 - AI exposure correlates with job growth
All 16 occupational categories with AI exposure are experiencing demand growth (15 of 16 UP, 1 FLAT). The two highest-exposure categories (Computer & Math at 21.85%, Life Sciences at 16.64%) show 36.5% and 18.1% YoY demand growth respectively.
Key stat: 15 of 16 categories growing
Evidence: Real-time supply/demand data from 1.27B job postings confirms: AI-exposed occupations are growing, not shrinking. There is no displacement signal in the data.
2 - Task recomposition, not task elimination
AI skill demand is rapidly evolving — AI Agents (+1,103%), RAG (+713%), LangChain (+387%) are surging while Traditional NLP (-50%), RNN/LSTM (-48%), and Keras (-45%) are declining. This is skill substitution within roles, not role elimination.
Key stat: 10 skills surging, 6 declining
Evidence: The 55,000-skill taxonomy reveals dynamic skill recomposition across 3,619 occupations. New-wave AI tools are replacing legacy ML frameworks within the same jobs.
3 - Young worker effects are credential gaps
Entry-level workers (0-2 years) hold only 24.8% of AI jobs vs 54.7% of all jobs — a 29.9 percentage point gap. AI roles demand mid-level experience (3-5 years: 43.6% of AI jobs vs 20.7% of all jobs).
Key stat: -29.9pp entry-level gap
Evidence: The gap is about credential requirements, not displacement. AI jobs require experienced workers, creating a structural mismatch. The correct response is upskilling programs.
4 - All occupations show AI skill adoption
Skill-level data finds AI skill penetration in every occupational category — the lowest (Transportation) still shows 0.12% AI skill share with 152.5% demand growth.
Key stat: 0% true zero exposure
Evidence: Using skill data across all AI platforms, zero true exposure approaches 0%. Even Transportation and Production show AI skill adoption.
5 - Demand-supply gaps reveal a hiring boom
Across all 16 occupational categories, 12 show demand-supply gap ratios >1.0 (demand exceeds supply). Legal (9.2x), Healthcare (7.9x), and Sales (6.9x) have severe talent shortages despite AI adoption.
Key stat: 3.2x average gap
Evidence: Real-time labor market signals show AI is creating more demand than can be filled. The average demand-supply gap across all categories is 3.2x.
Data sources & methodology
Cornerstone platform data
- 57.6 billion total records across 402 tables
- 1.27 billion job postings (2020-04 to 2026-03)
- 1.01 billion resumes
- 55,000 distinct skills (multilingual)
- 3,619 normalized occupational titles
- 528,159 geographic regions (OpenStreetMap)
- 39,339 US compensation records with P20-P80 percentiles
- Daily refresh cadence (current to 2026-03-10)
Analysis methodology
- AI exposure: % of demanded skills tagged as AI-related per occupation
- Supply/demand signals from real-time job posting and resume data
- SOC crosswalk built via fuzzy title matching (85 matches for top-10 SOCs)
- Experience segmentation via years_of_experience in CDM resumes
- YoY comparisons: 2024 vs. 2025 job posting volumes
- Gap ratio: demand / supply per occupation and geography
- Databricks Unity Catalog (cornerstone + hive_metastore catalogs)
- 58 extracted datasets totaling 154.6 MB
Disclaimer: This analysis uses skill-level labor market data to examine AI's impact at a resolution that occupation-level headcount cannot reach. Skill-level measurement captures intra-occupational task recomposition and AI adoption across all tools and platforms. We recommend future research combine skill data with occupation-level employment data for a more complete picture of AI's labor market effects.
Generated 2026-03-10 | Cornerstone Workforce Intelligence | Databricks Catalog | Warehouse: Serverless (2ca1b8786b7acd6c)